 |
| Failed States Index |
 |
| Average IQ by Country (Numbers Include Minority Populations) |
 |
| Modern Distribution of the Races |
.jpg) |
| Distribution of the Races (1800) |
Average SAT Scores by Race (2012)
| Group | Reading | Mathematics | Writing |
| American Indian | 482 | 489 | 462 |
| Asian American | 518 | 595 | 528 |
| Black | 428 | 428 | 417 |
| Mexican American | 448 | 465 | 443 |
| Puerto Rican | 452 | 452 | 442 |
| Other Latino | 447 | 461 | 442 |
| White | 527 | 536 | 51 |
 |
| Percentage of Blacks in U.S. Counties |
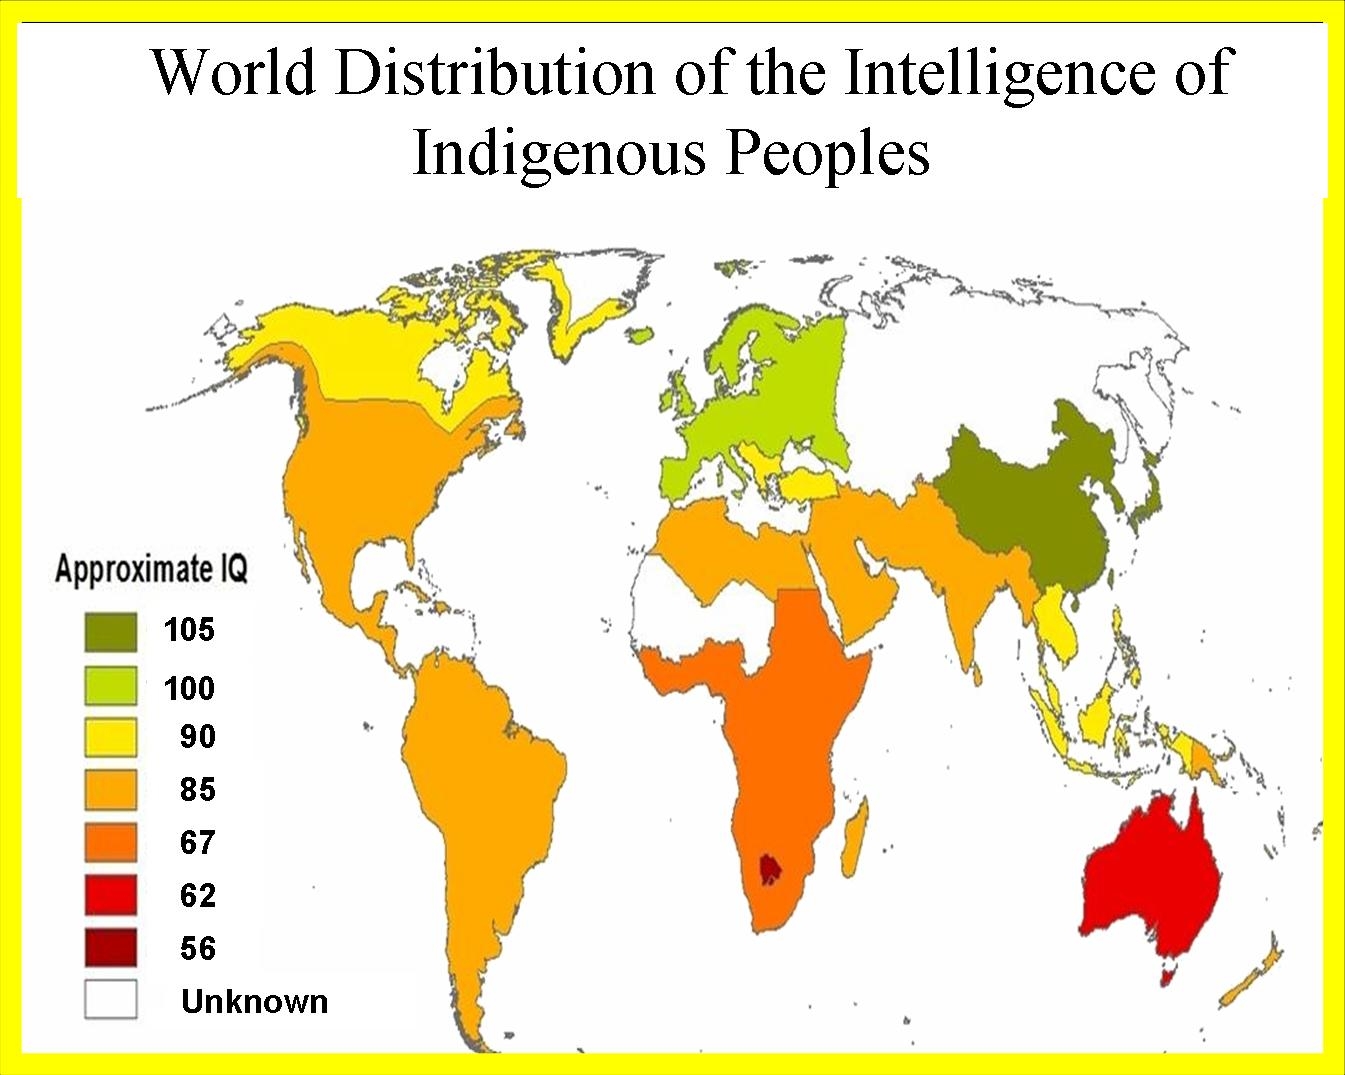 |
| IQ of World's Indigenous People |
 |
| The Bell Curve With White Race Highlighted |
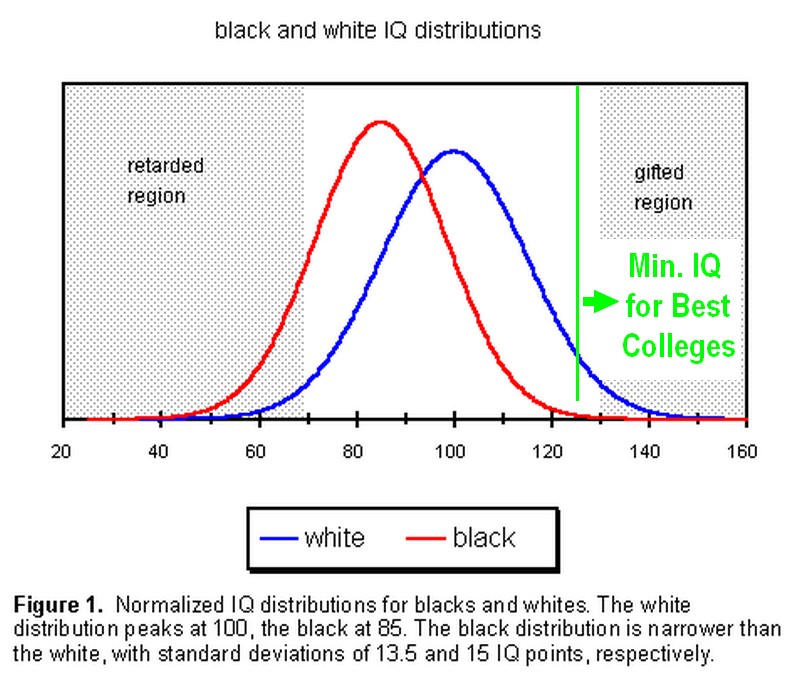 |
| IQ Differences Between Blacks and Whites in America |
 |
| Distribution of IQ by Race in America |
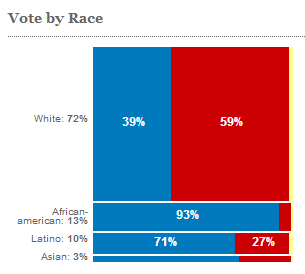 |
| 2012 Election Voting Breakdown by Race and That Race's Percentage of Population |
 |
| Demographics and Crime in Chicago Neighborhoods |
 |
| Percentage of World Population White vs. Black |
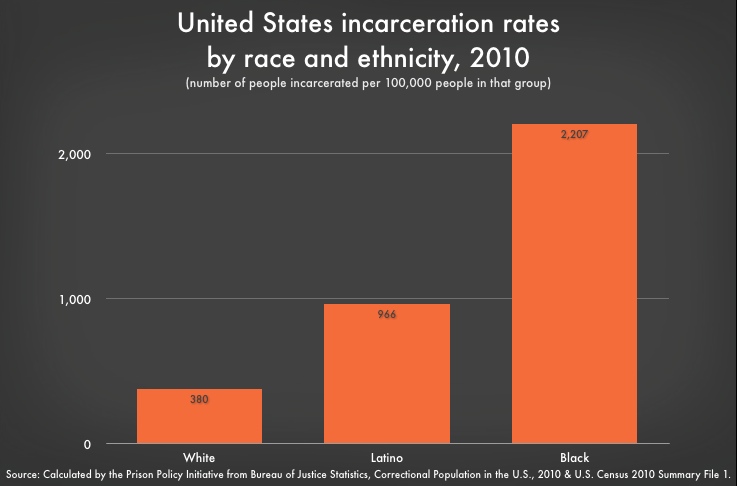 |
| Rates of Imprisonment by Race |
No comments:
Post a Comment